Ch. 11-12: Periodic Motion, Mechanical Waves, and Sound
Reading
College Physics, Ch. 11 & 12
AP Classroom: Unit 6 "Simple Harmonic Motion"
AP Princeton Review: Ch. 9
Topics
Labs
College Physics, Ch. 11 & 12
AP Classroom: Unit 6 "Simple Harmonic Motion"
AP Princeton Review: Ch. 9
Topics
- Mechanical waves & sound
- Pendulums
- Spring-Mass systems
Labs
- Spring-Mass and Pendulum lab. Instructions below.
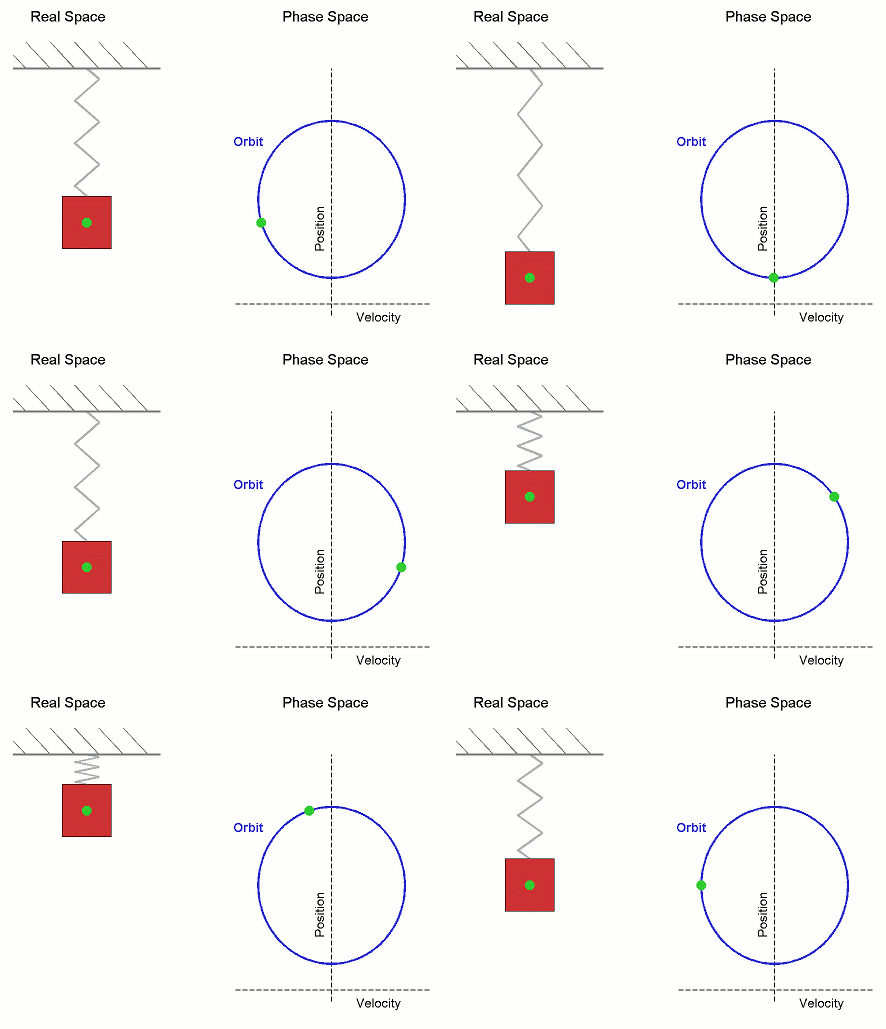
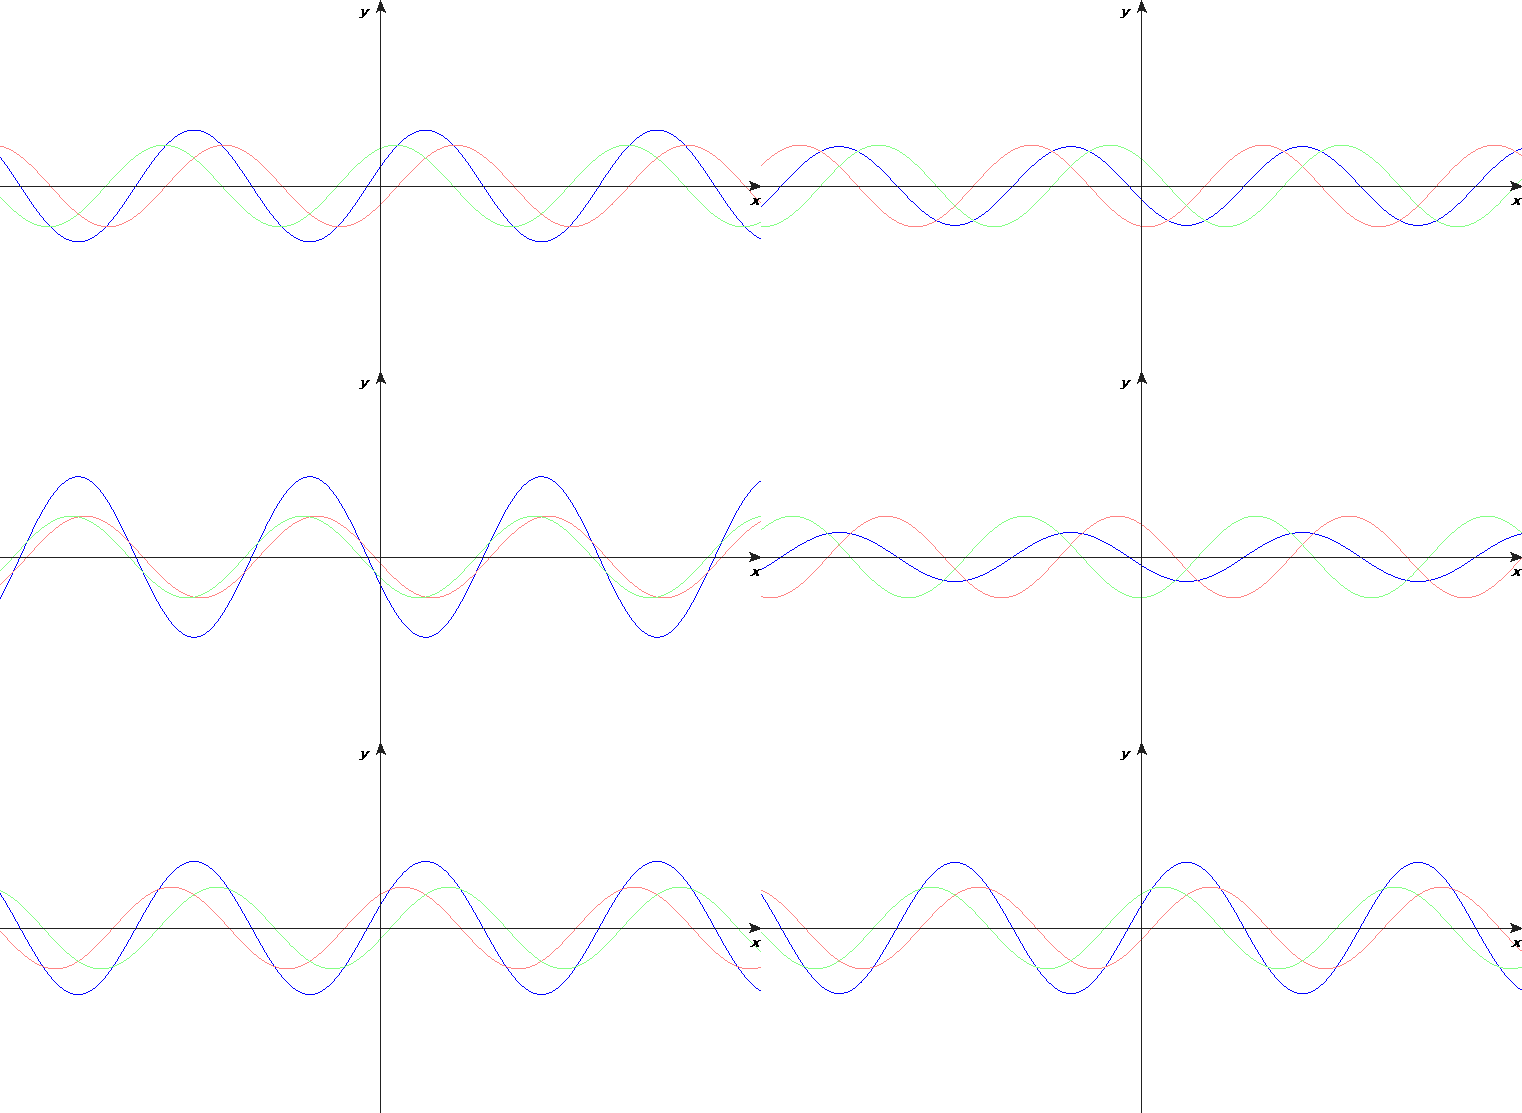
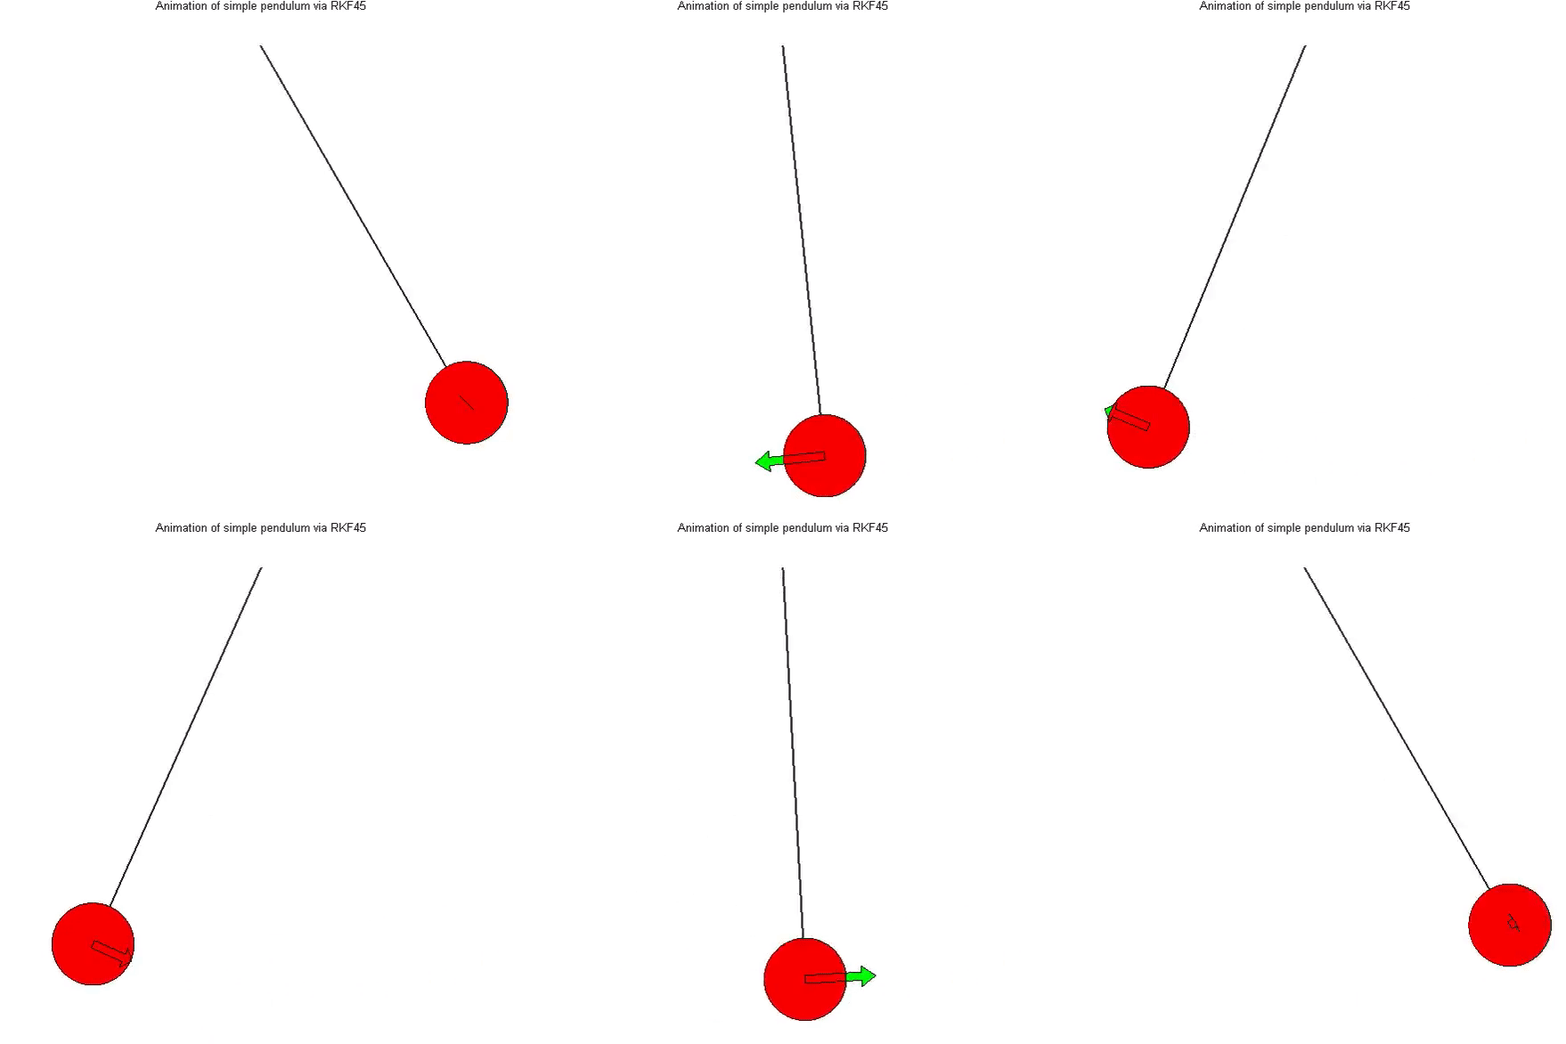
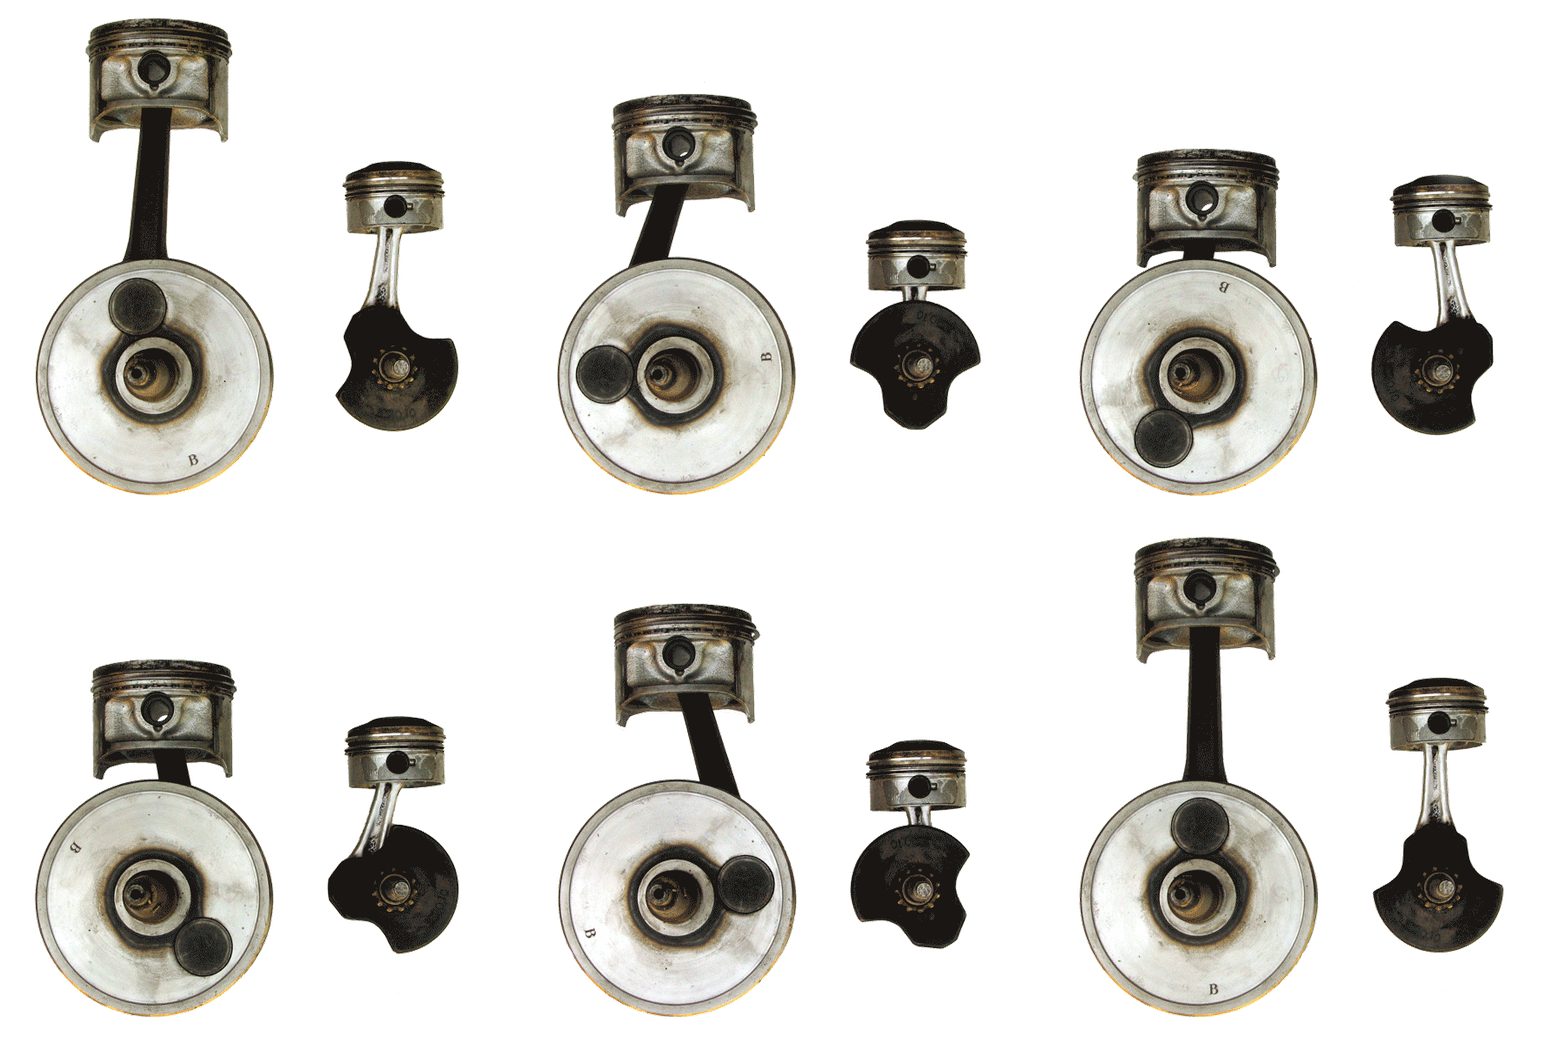
Below: Various ways of depicting periodic motion
| 9._periodic_motion_2023__lecture_1_-_simple_harmonic_motion_.docx |
| 9._periodic_motion_2022__lecture_2_including_ap_notes_.docx |
Spring-Mass and Pendulum lab
This lab illustrates all the concepts, plus a bit of statistics. It's a good lab, and we usually get very close to "theoretical" values - which is not always the case with Physics labs.
In-person lab:
Write up your lab results from the Pendulum and Spring-Mass experiments. Use the lab handout for guidance, but you must use your own measurements and sketches! Make sure you include all the required items, below.
At-home lab:
If you are doing this lab at home, use the raw data in the Lab Video below. You need to write-up your lab report just like the "Instructor Example", but using the raw data in the Data Gathering video. Make sure you include all the required items, below.
Deliverables:
Required for your pendulum experiment:
- Labeled sketches and raw data from your pendulum experiment, showing the mass of the pendulum, length of the pendulum arm, the measured period 'T' of your pendulum (taken from your stopwatch measurements).
- Your calculations showing the 'theoretical' period 'T' in seconds of your pendulum, using the pendulum formula T = 2 x pi (l/g)^1/2.
- A comparison of your 'measured' T-value (from stopwatch) to your 'theoretical' T-value, and a calculation of your % error.
- Labeled sketches and raw data from your spring-mass experiment, showing the mass of the plumb-bob, and the measured period 'T' of your spring-mass system (taken from your stopwatch measurements).
- A graph of the restoring force in N (y-axis) versus the spring displacement in m (x-axis) for your spring.
- A computation of the 'slope' of the line in the above graph, which represents 'k', the spring constant, in the formula F = k(delta-x). Remember slope is defined as 'rise over run', or delta-y/delta-x.
- Your calculations showing the 'theoretical' period 'T' in seconds of your spring-mass system, using the formula T = 2 x pi (m/k)^1/2.
- A comparison of your 'measured' T-value (from stopwatch) to your 'theoretical' T-value, and a calculation of your % error.
| 9._periodic_motion_lab_handout.docx |
| You can use this engineering_graph_paper_10_per_inch.docx |
Lab video:
This video gives a quick overview of the lab, plus shows all the raw data if you're doing the lab at-home.
This video gives a quick overview of the lab, plus shows all the raw data if you're doing the lab at-home.
Homework
The Periodic Motion problems are hosted in Canvas.
The Periodic Motion problems are hosted in Canvas.


